Direct Line 831.566.3127     Email Kathleen.manning@sothebys.realty     License: DRE# 00885315
Kathleen Manning

Kathleen Manning

Monterey
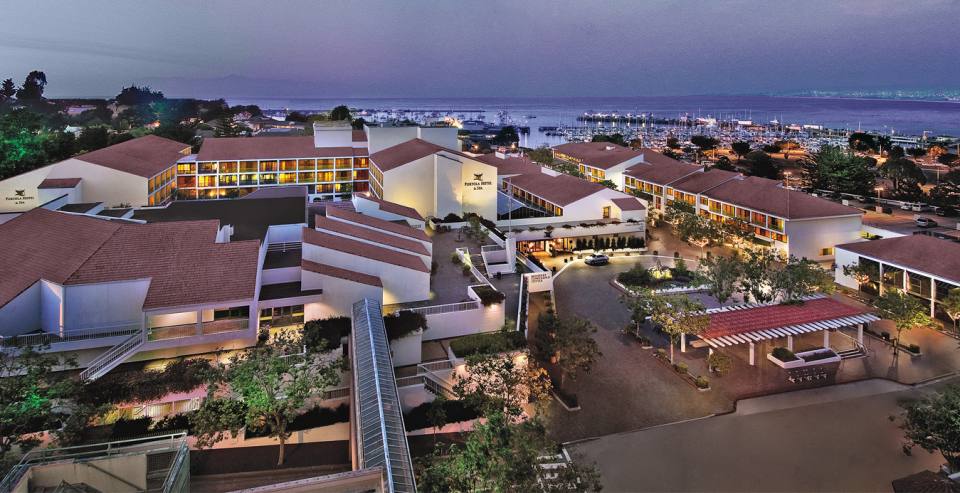
 

The City of Monterey is a vibrant,  historic community situated on majestic coastline in the southernmost curve of Monterey Bay. Boasting a colorful history, Monterey was the capital of the state’s Spanish territory in its early days. Today, the city’s “Path of History” tour encompasses the city’s impressive collection of carefully restored historic buildings and Spanish adobes. The city’s most famous landmark, however, is undoubtedly the blue-green waters of Monterey Bay. The most popular attractions are located along this shoreline, including Cannery Row, Fisherman’s Wharf, the very lively downtown district, and the famous Monterey Bay Aquarium.

Internationally known for its mild Mediterranean climate, spectacular vistas, championship golf, historic attractions, and festive annual events, Monterey draws thousands of visitors from across the country each year. Newcomers to the city will find themselves fortunate enough to enjoy these amenities every day. In September, Monterey hosts the Monterey Jazz Festival, a 12-concert, three-day event. The city’s Maritime Museum celebrates Monterey’s seafaring heritage. Other attractions include Laguna Seca Raceway, a legendary racetrack that hosts five major events each year. For more info Click Here….

Casanova/Oak Knoll (30-day trend)
 
Number of Properties
Avg Price
Avg $/SQFT
Avg DOM
% of Avg Sold Price/Avg List Price
Active
1 (Number of Properties)
$824,400 (Avg Price)
$1,017 (Avg $/SQFT)
29 (Avg DOM)
Sold
1 (Number of Properties)
$724,313 (Avg Price)
$773 (Avg $/SQFT)
54 (Avg DOM)
96% (% of Avg Sold Price/Avg List Price)
Mar Vista (30-day trend)
 
Number of Properties
Avg Price
Avg $/SQFT
Avg DOM
% of Avg Sold Price/Avg List Price
Active
1 (Number of Properties)
$995,454 (Avg Price)
$633 (Avg $/SQFT)
69 (Avg DOM)
Sold
3 (Number of Properties)
$1,207,126 (Avg Price)
$512 (Avg $/SQFT)
36 (Avg DOM)
96% (% of Avg Sold Price/Avg List Price)
Old Town Monterey (30-day trend)
 
Number of Properties
Avg Price
Avg $/SQFT
Avg DOM
% of Avg Sold Price/Avg List Price
Active
0 (Number of Properties)
$1,325,000 (Avg Price)
$630 (Avg $/SQFT)
173 (Avg DOM)
Sold
0 (Number of Properties)
$0 (Avg Price)
$0 (Avg $/SQFT)
0 (Avg DOM)
0% (% of Avg Sold Price/Avg List Price)
Alta Mesa/Glenwood Circle (30-day trend)
 
Number of Properties
Avg Price
Avg $/SQFT
Avg DOM
% of Avg Sold Price/Avg List Price
Active
2 (Number of Properties)
$1,131,621 (Avg Price)
$818 (Avg $/SQFT)
26 (Avg DOM)
Sold
0 (Number of Properties)
$599,000 (Avg Price)
$788 (Avg $/SQFT)
32 (Avg DOM)
100% (% of Avg Sold Price/Avg List Price)
Cannery Row/Lighthouse Business (30-day trend)
 
Number of Properties
Avg Price
Avg $/SQFT
Avg DOM
% of Avg Sold Price/Avg List Price
Active
2 (Number of Properties)
$1,923,371 (Avg Price)
$1,370 (Avg $/SQFT)
59 (Avg DOM)
Sold
0 (Number of Properties)
$1,475,000 (Avg Price)
$1,100 (Avg $/SQFT)
164 (Avg DOM)
96% (% of Avg Sold Price/Avg List Price)
Downtown/Fisherman Wharf (30-day trend)
 
Number of Properties
Avg Price
Avg $/SQFT
Avg DOM
% of Avg Sold Price/Avg List Price
Active
1 (Number of Properties)
$1,425,000 (Avg Price)
$570 (Avg $/SQFT)
50 (Avg DOM)
Sold
0 (Number of Properties)
$0 (Avg Price)
$0 (Avg $/SQFT)
0 (Avg DOM)
0% (% of Avg Sold Price/Avg List Price)
Oak Grove (30-day trend)
 
Number of Properties
Avg Price
Avg $/SQFT
Avg DOM
% of Avg Sold Price/Avg List Price
Active
1 (Number of Properties)
$845,000 (Avg Price)
$719 (Avg $/SQFT)
120 (Avg DOM)
Sold
2 (Number of Properties)
$1,399,550 (Avg Price)
$697 (Avg $/SQFT)
44 (Avg DOM)
101% (% of Avg Sold Price/Avg List Price)
Deer Flats/Fisherman Flats (30-day trend)
 
Number of Properties
Avg Price
Avg $/SQFT
Avg DOM
% of Avg Sold Price/Avg List Price
Active
6 (Number of Properties)
$1,146,822 (Avg Price)
$727 (Avg $/SQFT)
49 (Avg DOM)
Sold
0 (Number of Properties)
$1,550,000 (Avg Price)
$625 (Avg $/SQFT)
40 (Avg DOM)
106% (% of Avg Sold Price/Avg List Price)
Old Del Monte/Aguajito (30-day trend)
 
Number of Properties
Avg Price
Avg $/SQFT
Avg DOM
% of Avg Sold Price/Avg List Price
Active
0 (Number of Properties)
Villa Del Monte/Del Monte Grove (30-day trend)
 
Number of Properties
Avg Price
Avg $/SQFT
Avg DOM
% of Avg Sold Price/Avg List Price
Active
8 (Number of Properties)
$813,915 (Avg Price)
$713 (Avg $/SQFT)
59 (Avg DOM)
Sold
3 (Number of Properties)
$761,419 (Avg Price)
$668 (Avg $/SQFT)
47 (Avg DOM)
99% (% of Avg Sold Price/Avg List Price)
Del Monte Beach (30-day trend)
 
Number of Properties
Avg Price
Avg $/SQFT
Avg DOM
% of Avg Sold Price/Avg List Price
Active
2 (Number of Properties)
$1,084,280 (Avg Price)
$1,383 (Avg $/SQFT)
93 (Avg DOM)
Sold
0 (Number of Properties)
$1,250,000 (Avg Price)
$1,276 (Avg $/SQFT)
20 (Avg DOM)
100% (% of Avg Sold Price/Avg List Price)
Monte Rogio/Peters Gate (30-day trend)
 
Number of Properties
Avg Price
Avg $/SQFT
Avg DOM
% of Avg Sold Price/Avg List Price
Active
4 (Number of Properties)
$1,757,821 (Avg Price)
$738 (Avg $/SQFT)
186 (Avg DOM)
Sold
1 (Number of Properties)
$1,663,000 (Avg Price)
$521 (Avg $/SQFT)
115 (Avg DOM)
92% (% of Avg Sold Price/Avg List Price)
Monte Vista (30-day trend)
 
Number of Properties
Avg Price
Avg $/SQFT
Avg DOM
% of Avg Sold Price/Avg List Price
Active
2 (Number of Properties)
$653,600 (Avg Price)
$817 (Avg $/SQFT)
112 (Avg DOM)
Sold
1 (Number of Properties)
$500,000 (Avg Price)
$892 (Avg $/SQFT)
213 (Avg DOM)
95% (% of Avg Sold Price/Avg List Price)
New Monterey (30-day trend)
 
Number of Properties
Avg Price
Avg $/SQFT
Avg DOM
% of Avg Sold Price/Avg List Price
Active
6 (Number of Properties)
$1,891,233 (Avg Price)
$967 (Avg $/SQFT)
73 (Avg DOM)
Sold
2 (Number of Properties)
$1,094,593 (Avg Price)
$943 (Avg $/SQFT)
80 (Avg DOM)
100% (% of Avg Sold Price/Avg List Price)
Skyline Forest/Skyline Ridge (30-day trend)
 
Number of Properties
Avg Price
Avg $/SQFT
Avg DOM
% of Avg Sold Price/Avg List Price
Active
2 (Number of Properties)
$1,214,823 (Avg Price)
$702 (Avg $/SQFT)
34 (Avg DOM)
Sold
1 (Number of Properties)
$1,367,142 (Avg Price)
$669 (Avg $/SQFT)
60 (Avg DOM)
100% (% of Avg Sold Price/Avg List Price)

Property Info